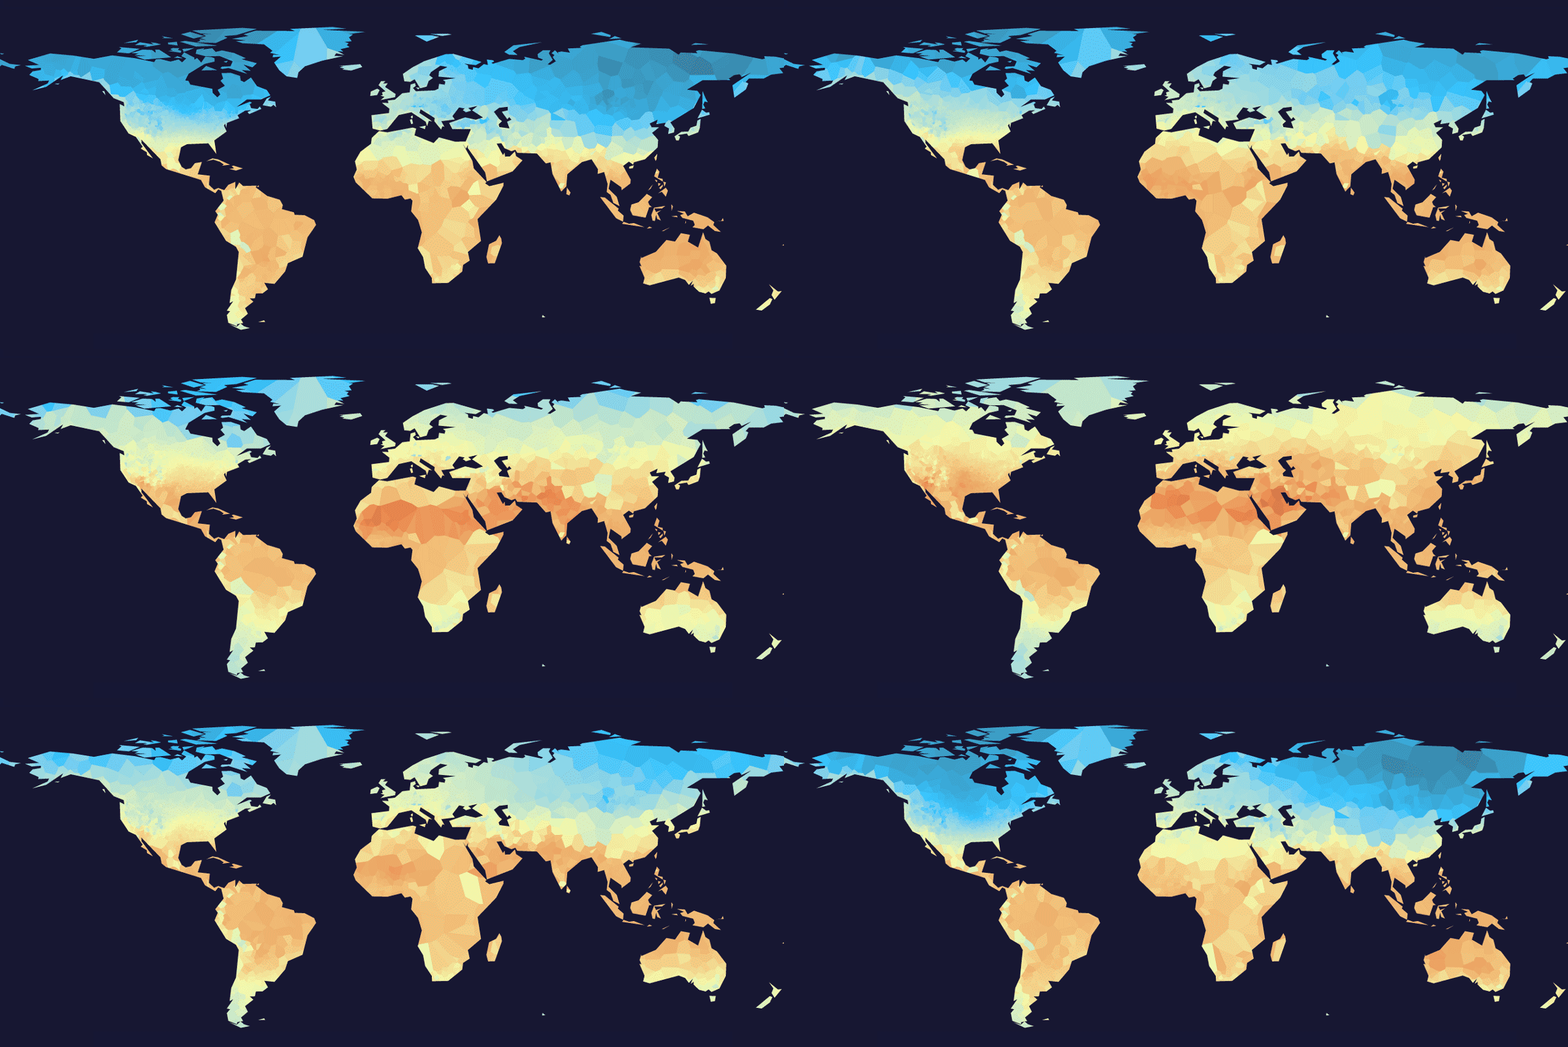
Global Land Temperatures since 1900

Launch

The story of this project begins with coffee.
Curious to learn more about the subject of our addiction, we explored worldwide coffee production data, and tossed around ideas for interactively demonstrating optimal growing regions based on the key environmental conditions: temperature, precipitation, altitude, sunlight, wind, and soil quality.
In the process of gathering data, we found that monthly temperature data was readily available from NOAA's National Climatic Data Center, while datasets relating to the other aspects of coffee growing were not easy to find.
So, in the spirit of experimentation, accidental discovery, and community discussion, we release this prototype which displays over 100 years of average monthly land temperature data collected from over 7,200 climate monitoring stations which have appeared and disappeared in NOAA's dataset. Our goal with this project was not to facilitate precise analysis, but to expose how every single month produces a unique and beautiful artwork through our Voronoi tessellated approximation of a heat map. The underlying map of satellite imagery and major geographic features adds a second layer for exploration.
Coffee designed by Jacob Halton from The Noun Project

